Wednesday, November 9, 2016

Another Post-election Reflection


As we sit back in our echo chambers this morning, plotting resistance and obstructionism to a Trump Presidency, I urge us all to also reflect on what brought us here. On what brought us a populist leader who extols the virtues of economic isolationism and American superiority, while simultaneously engaging in Twitter arguments unbecoming of a teenager. I offer one narrative:

The quest for progress without empathy has alienated the working class.

I understand that when we are fighting for the rights of the persecuted, there might not be much room for empathy, but this isn’t about those times. This about when new regulation to protect the Spotted Owl puts anend to a way of life in small Oregon towns. This is about when an Executive Order leads to the closing of hundreds of coal-fired power plants, and with it, the jobs that kept their communities on the map. This is about the free-trade agreements that enabled easy off shoring of manufacturing jobs and the countless retraining programs that have never delivered on their promises.

In the coming four years, the left needs to do better. Some of that must come in the form of confronting the increasingly warped tools of democracy (See voter ID laws, the electoral college and gerrymandering), but the rest needs to come in the form of truly reaching out to the right to understand how progressive policies can be molded to deal with their concerns and needs too.

Without this bridge and the difficult compromises that come with it, I fear that we just might deserve the political reality we are now living in.


Sunday, June 5, 2016

What will it cost to retire coal early in Alberta?


TransAlta's Sundance power plant. The Alberta Utilities Commission says TransAlta deliberately timed outages at power plants in Alberta at peak times in order to drive up electricity prices.
TransAlta's Sundance Power Plant
Source: Financial Post c/o TransAlta

What will it cost to retire coal early in Alberta?
There seems to be no shortage of opinion pieces seeking to address this question in papers ranging from the Calgary Herald to the Financial Post. One such article, “Get ready Albertans, you’re about to pay a steep bill to kill coal,” echoes the concerns of many Albertans I know and I want to explore these concerns more fully and quantitatively than most of the articles I have seen to date. For those just looking for the answer to how much I estimate it will cost to retire coal early in Alberta, feel free to skip to the conclusion below. 

Caveat/Fine print: my analysis does not model the complex realities of the deregulated, multi-actor bidding system that is the Alberta electricity system. Instead, it relies on a simpler analysis involving levelized costs of energy over the lifetime of power plants, which should, in theory be recovered in the long-run. That being said, it has its limitations. Also, I also do not weigh in on the potential lawsuits from coal-fired power plant owners which may result from the early retirement of their facilities. These lawsuits could have a large impact on the final cost of coal retirement.

Alberta’s grid was not necessarily on track to be just 10% coal by 2034
Many authors have been claiming that Alberta's grid will be 10% coal-fired by 2034, and while this claim has some merit, it is also misleading. The authors use what is referred to as power plant capacity when deriving their numbers. This means the maximum potential of a particular power plant to produce energy in a given time-period. The problem with this is that it doesn’t show how often the different power plants are being used. For example, in 2014, coal made up 41% of the power capacity in the province, but produced 55% of our energy. Wind on the other hand, made up 10% of the capacity, but produced 4% of our total energy (Source: Alberta Utilities Commission). As you can see in the graph below, capacity doesn’t show how much each fuel is contributing to energy production in the province.        

Coal-fired power plants also make up an overwhelming percentage of carbon and other air emissions (mercury, sulfur dioxide, etc.) from electricity production. In 2011, coal made up 55% of the MWh produced, but accounted for 91% of the carbon emissions from the electricity sector (Source: Alberta Utilities Commission and the Federal National Pollutant Release Inventory).      

Ontario’s electricity prices have not increased by 80% due to coal being retired in the province
It is unwise to compare the Alberta and Ontario electricity markets for a number of reasons. To understand why, we need to look at how each of these provinces deregulated their energy sectors.

What the hell is deregulation?
Deregulation refers to how a province changes from the government signing individual contracts with power plants for electricity to a centralized market where power plants bid their production every half-hour or hour.

Why does it matter how you go from one to the other?
Regulated markets are managed by the government or central utility, which pays a set price for electricity over the life of the power plants. In order for the market mentioned above to function properly, these contracts must be “transitioned” to the market. That is, these power plants must be paid out for the value of the contracts, or that value must be accounted for in the new system.

So how did Alberta deal with these contracts?
Alberta managed these contracts by auctioning off the rights of the power to another party through a government agency called the Balancing Pool. For example, TransCanada bought the Power Purchase Agreement for the Sheerness Power Station for 20 years for $585 million. Through this, the government was able to cover the cost of the pre-existing contracts, and the company that bought the rights to the power plant could bid the plant into the market as it saw fit. Many of the corporations who owned these contracts have stepped away from them since NDP passed their new carbon regulations and the impact of this is a major uncertainty. For more information on Alberta's deregulation, see the AESO's Deregulation Report)

According to the Auditor General's report in December 2015, Ontario overpaid for much of its renewable energy capacity.


How did Ontario do it?
Ontario developed something called the Global Adjustment, a cost that fluctuates based on the average price of the market to make sure that power plants recovered the revenue that they were guaranteed through the existing contracts. This eliminates the ability for the market to drive cost-savings as any decrease in the market price for electricity is later accounted for by an increase in the global adjustment.

Why have Ontario’s power prices increased so much in the past decade?
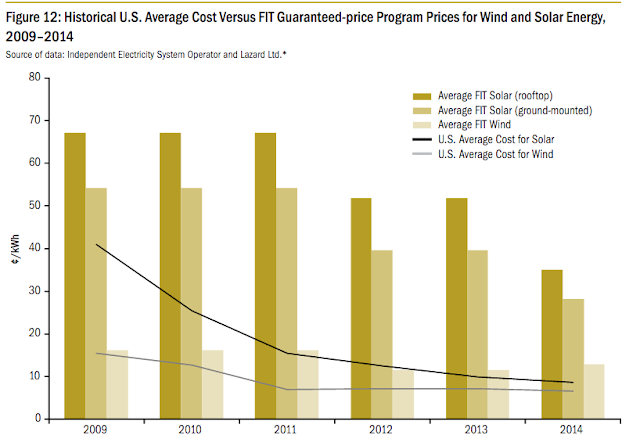
Ontario’s power prices have increased due to a number of policies introduced in the past decade. This includes a Feed-in Tariff program, which has been widely criticized for inefficiently and artificially establishing rates paid to renewable generators.

According to the Ontario auditor general, the renewable energy contracts signed through this and other programs is responsible for $9.2 billion or about 33% of the increase in Ontario’s power prices. Alternatively, early coal retirement is more difficult to obtain numbers for. However, based on 2010 filing with the Ontario government, OPG had liabilities relating to Power Purchase Agreements of around $2.2 billion, some of which would have been regarding the Nanticoke and Lambton coal-fired power plants, the two largest by far of the four coal plants that were retired in Ontario. We could conclude from this that coal retirement is therefore not the main culprit in the rise of Ontario’s power prices.

The unanswered question: What will happen to Alberta energy costs because of coal?
To understand the cost of retiring coal early, you can’t simply look at the cost of building new power plants, because consumers in Alberta are not charged based on this capital cost. Instead, you have to compare the marginal cost of each power plant type with the inclusion of the increased carbon tax. In addition, you also have to factor in when those power plants would have been built anyway and then count only the additional cost for the additional years. Coal power plants in the province will be retired on the schedule below as a result of rules established by the Harper administration:


The bulk of the coal-fired power plants will be offline by 2034. This means that the increase to our power bills is the increase in cost to the dispatched energy from the 2.5 GW of coal that would have remained online.

The cost to retire coal early
With this in mind we can use the average Alberta grid price, the cost per MWh of new natural gas generation, and the differences in carbon content of the coal-fired and natural gas-fired generation to build a model estimating the increased costs to the energy system in Alberta because of early coal retirements.

The increase in costs would be around $7.5 Billion on 80TWh of energy per year, or $3.34/MWh. This would result in an increase of about 10% to Alberta wholesale energy prices. For consumers, wholesale energy prices make up around 37% of your energy bill. So the cost to the average household is about $1.10 per month. This will result in a reduction of carbon emissions by almost 95 million tonnes, almost the annual emissions of the entire Albertan oil sands and it will dramatically lower the mercury and sulfur dioxide emissions in the province (human impacts of Mercury and Sulfur Dioxide in the Atmosphere).

According to Energy Alberta, more than 10,000 people are employed by the coal industry in Alberta
Thirteen dollars per year per Albertan household hardly seems to be the economic doomsday that many project, but some people are saying that the slow addition of small expenses such as this may eventually break the back of the Albertan economy, and this must be part of the analysis. What is the impact of all additional costs associated with NDP programs and how do we make sure that not only are these costs worthwhile, but also affordable? Last, when the coal plants close, the communities that have benefited from these jobs for decades will face economic difficulties. The NDP must put forward a plan for the economic transition of these communities and the entire province should push them for it.

For those interested in a much more in-depth analysis, take a look at Genalta’s paper. Note: this paper was written before the fall of oil prices and as a result, reflects the power prices of that time.

More information: Consumer Energy cost breakdown (June 2016) 
 
Source: https://www.enmax.com/ForYourHomeSite/Documents/2015-10-01-DT-Rate-Schedule.pdf

Sources
National Pollutant Release Inventory: 

Tuesday, November 3, 2015

The Economics of Squirrels! or What is GDP and how does it grow?

The economic world of squirrels
After reading my last post on minimum wage policy, a friend of mine asked: “does increasing the minimum wage actually increase the overall supply of goods, or does it simply redistribute that existing fixed quantity?” This is a very cool question, and to answer it, we first have to understand what makes up gross domestic product (GDP).
           
What is GDP?
GDP is the total amount of value produced by a country in a calendar year. It is the sum of what everyone spends, what everyone invests, what the government spends and what the country sends to and receives from other countries. The equation looks like this:

GDP =


So, let’s say that six squirrels live in the same tree and each squirrel can gather 100 nuts in a year. The government then taxes each squirrel 10 nuts, and spends those 60 nuts fixing up the tree. A squirrel-preneur, whom we will call Richard spends 50 of his nuts building a store to sell peanut butter, and Jim (the really excited guy on the right) exports 10 nuts to a neighboring tree and all other nuts are consumed. The GDP here is:

Consumer: Production: (100 x 6) – Taxes: (10 x 6) – Savings: (50 + 10) = 480
Government: 60
Investment: 50
Exports: 10
Imports: 0
GDP = 600.

What makes GDP grow?
Because GDP is the main measure of prosperity in our world, we are often obsessed with making it grow. So how could we increase the GDP of this tree?

The first way of increasing the output of the tree would be to add more squirrels. As population grows, so does GDP, because each additional squirrel can harvest 100 more nuts per year.
Squirrel Babies!
The second major influence on GDP is technology. If the squirrels are given reacher-grabbers, they can gather more nuts, increasing their production and the tree’s GDP.
The internet does not yet have a picture of squirrels using reacher-grabbers, 
it’s never let me down like this before. 
The last major influence is capital. This is the investment in factories, machines, buildings, etc. that can be used to produce additional goods. In this example, the peanut butter store built by Peter is an investment in capital. Technology and capital both add to GDP because they increase the productivity of workers, or replace workers and allow them to labour elsewhere without decreasing the tree’s productivity.


These three things: population growth, technology and capital are the only methods of increasing total economic output in the long run. If the population doesn’t grow, and investment and technology remains the same, GDP does not grow.

But GDP changes all the time!
Yes, GDP changes all the time for a variety of reasons: first, the human population continues to grow.


Second, technology is making us more productive:
This is okay, but my dream is to be an automatic teller.
Third, since 2006, Canada has invested an average of 23.5% of its GDP into fixed capital (stores, factories, oil rigs, etc.). This money continues to improve the efficiency of works and develop new products like the iPhone 6S.

Last, there are many methods of adjusting when certain transactions are realized. For example, if you raise interest rates, people are more likely to save their money, deferring the production and purchase of things like cars and houses. This means GDP this year will decrease, but the total economic output of the system is not necessarily impacted, as that money might be spent next year instead. This gets at the concept of long-run equilibrium, which you can read about here.

So back to the original question: would increasing minimum wage raise total economic output?
The answer is: not necessarily. This is because when you raise minimum wage, you are mostly diverting money that would have otherwise been saved or spent elsewhere into increased labour costs.  Thus, you are not changing the total economic value of the system, but just adjusting when that value is realized. 

For example, McDonald’s will be required to pay its employees more money, meaning they will charge more for cheeseburgers, so families dining there will have less disposable income to save or spend elsewhere. Therefore, money that would have been spent later (perhaps after retirement?) is being spent now on a more expensive Big Mac.

However, the additional money that is being earned by minimum wage employees is then spent, and spent again, and again (according to the multiplier effect – see my last blog post), which could produce more economic value this year than would have been created if that money had been saved or spent elsewhere. This additional economic value might then be invested (in technology or factories), or used to afford more children, increasing long-run economic output.

Thanks for reading
Let me know if you have any questions about minimum wage policy, or if you would like me to cover a particular economic topic in the future. For my next post, I am going to look at murder rates and gun policy.

Sunday, September 6, 2015

What happens when you raise minimum wage?

What happens when you raise minimum wage?
Since the NDP was elected in May, a fierce debate has raged in Alberta. On one side, proponents herald a “living wage” for all Albertans, and on the other, opponents predict economic destruction.

This post discusses who makes minimum wage, what has happened in the past when minimum wage was increased, and what could happen to Alberta when the minimum wage is raised over the next few years.

Who makes minimum wage in Alberta?
According to Labour Alberta, about 370,000 workers (or 22% of the working population) in Alberta make less than $15/hour. With 38,000 people making the current minimum wage of $10.20/hour ($9.20 if you’re serving alcohol).

Aren’t teenagers the only ones making minimum wage?
65% of minimum wage earners are over 20, and 50% are 25 and over.


Aren’t minimum wage jobs temporary?
67% of people in Alberta work a minimum wage job as permanent, year-round employment.

Economic theory: raising minimum wage
Economic theory separates minimum wage impacts into three key categories:

1) Increased inefficiency (or unemployment) in the labour market,


2) Increased spending (or economic output) by those now making a higher wage,

Jerry the Giraffe pays Terry the Turtle to repair his kitchen sink 
and then buys carrots off this very entrepreneurial rabbit.


3) Increased spending by those receiving the increased spending by those making a higher wage (what economists call the multiplier effect).
Terry the turtle goes drinking with a bear in lederhosen and then pays a monkey cab driver to drive him home (don't drink and drive), and that entrepreneurial rabbit pays a hamster to do his taxes, and a dog to build an extension to his home. 
So theory says it could go either way, but what actually happens when you raise the minimum wage?
The Canadian Centre for Policy Alternatives analyzed every instance of raising minimum wage in Canada between 1982 and 2012 (70 times in total), and tried to isolate the impact that the increase in wages had. They found the unclear impact that theory suggests. Out of 70 times minimum wage was increased, 63 instances (90%) saw no connection between the increase in wages and higher or lower employment. In the remaining 10% of the times, an increase in employment was found 3 times, and a decrease was found 4 times.

Given how unclear the impacts are, what should we do?
Stats Canada’s recent report on minimum wage shows that it has remained largely unchanged in real terms (adjusted for inflation) since the 1970s. This means that in an average Canadian city, people making minimum wage today have roughly the same buying power as people who were making the minimum wage in 1973. However, in the province of Alberta, prices have increased faster than any other province (since 2002, inflation has been 32.4%), meaning that buying power of those making minimum wage has decreased substantially. Minimum wage is one way of making sure that all Albertans can afford to live.

But isn’t this increase to minimum wage bigger than others and won’t that cause prices to go sky-high?
To see what a shift from the current minimum wage of $10.20 an hour to $15.00  an hour looks from a business perspective, let’s imagine a made-up burger restaurant that sells 4,000 burgers each month in 2015:

Costs
Dollars per burger  
Labour (4 employees at $10.20 per hour)
$1.64
Buns/meat, etc.
$2.50
Rent ($1800 per month/4000 burgers)
$0.45

So how would the increase in labour costs affect the cost of this burger?
If Inflation over the three years is 2% per year, and minimum wage rises to $13 in 2016 and $15 in 2018, we can see the following impacts:


Over the course of three years, the cost of a burger for this business rose by less than $1, and 20% of this increase was from inflation! This example is fairly simple, but it does show that the impact to costs are likely quite modest and as a result, could be passed to consumers without causing them to buy less of it.

What is the potential impact to Alberta’s economy?
So if 370,000 people currently make below $15/hour, what is the economic impact of raising their wages to $15/hour?

Well we know that 38,600 employees make the minimum wage and the average wage in Alberta for the food and accommodation sector is $12.76, so those making less than $15/hour combine to make about $6.9 billion per year (or $18,740 per person before taxes).

At $15/hour, their wages combine for a little over $8.3 billion (or $22,500 per person before taxes). This additional $1.4 billion then gets spent and spent in the economy (multiplier effect). If minimum wage earners save 20% of their wages and spend the rest, then the impact to the Albertan economy could be almost $7 billion per year, or an increase of about 2%.

Thanks for reading
Let me know if you have any questions about minimum wage policy, or if you would like me to cover a particular economic topic in the future.

Sources